自定义组件
通用 ECharts 组件:支持 ECharts 的所有配置项,可渲染任意图表类型。同时支持绑定数据集,实现数据动态驱动。使用本组件需要具备一定的 ECharts 使用经验。
version 2.3.4+ date 20260515
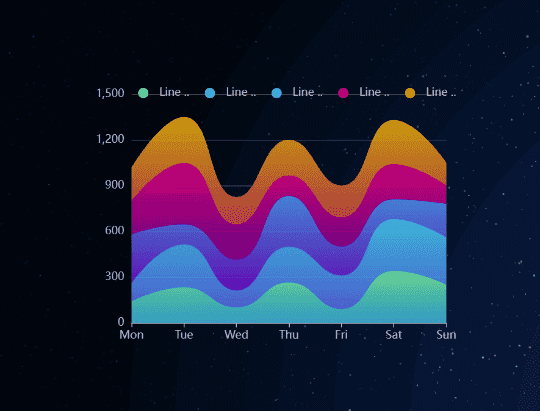
1、效果展示
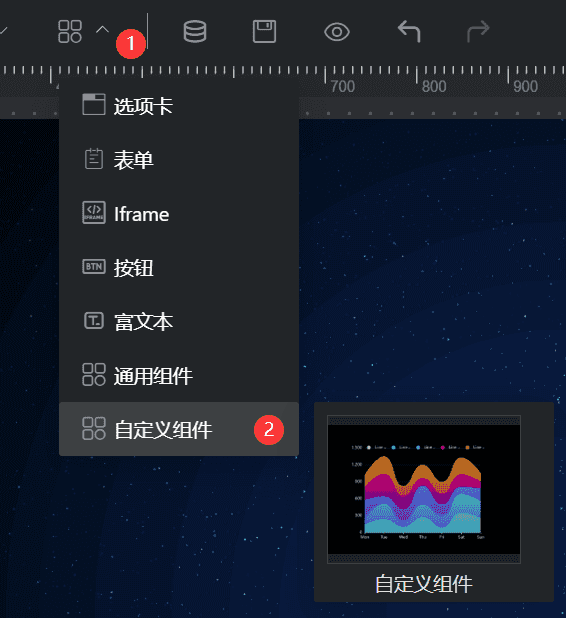
2、添加通用组件
3、样式配置
- 基础设置:(基础配置)
- 标题设置:(标题配置)
- 自定义配置:输入 ECharts 配置项
option内容,支持 JSON 格式和 JS 对象字面量(含new echarts.graphic.LinearGradient等),详见4、自定义配置格式 - 坐标轴边距:(坐标轴边距)
- 图例设置:(图例设置)
4、自定义配置格式
参考链接:
自定义配置框中输入的内容为 ECharts 的 option 对象,支持两种写法:
4.1 JSON 格式
标准 JSON,适合纯数据驱动的静态配置:
{
  "color": ["#80FFA5", "#00DDFF", "#37A2FF", "#FF0087", "#FFBF00"],
  "title": {
    "text": "折线图"
  },
  "tooltip": {
    "trigger": "axis",
    "axisPointer": {
      "type": "cross",
      "label": { "backgroundColor": "#6a7985" }
    }
  },
  "legend": {
    "data": ["Line 1", "Line 2", "Line 3", "Line 4", "Line 5"]
  },
  "grid": {
    "left": "3%",
    "right": "4%",
    "bottom": "3%",
    "containLabel": true
  },
  "xAxis": [{ "type": "category", "boundaryGap": false, "data": ["Mon", "Tue", "Wed", "Thu", "Fri", "Sat", "Sun"] }],
  "yAxis": [{ "type": "value" }],
  "series": [
    {
      "name": "Line 1",
      "type": "line",
      "stack": "Total",
      "smooth": true,
      "lineStyle": { "width": 0 },
      "showSymbol": false,
      "areaStyle": {
        "opacity": 0.8,
        "color": {
          "type": "linear", "x": 0, "y": 0, "x2": 0, "y2": 1,
          "colorStops": [
            { "offset": 0, "color": "rgb(128, 255, 165)" },
            { "offset": 1, "color": "rgb(1, 191, 236)" }
          ],
          "global": false
        }
      },
      "emphasis": { "focus": "series" },
      "data": [140, 232, 101, 264, 90, 340, 250]
    }
  ]
}
4.2 JS 对象字面量格式
支持 JavaScript 表达式,可使用 new echarts.graphic.LinearGradient 等 ECharts API,适合渐变色、复杂样式等场景:
{
  title: { text: "渐变柱状图" },
  xAxis: { data: ["A", "B", "C", "D"] },
  yAxis: {},
  series: [{
    type: "bar",
    data: [120, 200, 150, 80],
    itemStyle: {
      color: new echarts.graphic.LinearGradient(0, 0, 0, 1, [
        { offset: 0, color: "#83bff6" },
        { offset: 0.5, color: "#188df0" },
        { offset: 1, color: "#188df0" }
      ])
    }
  }]
}
JS 格式写法无需引号包裹 key,且可直接调用
echarts对象(已自动注入)。
5、数据集成
自定义组件支持绑定数据集,实现数据动态注入。绑定数据集后,组件会自动将数据填充到 series.data,无需在配置中硬编码数据。
5.1 数据格式要求
数据集返回的每条记录需包含以下字段:
| 字段名 | 类型 | 说明 |
|---|---|---|
name | string | 类目名称(X 轴标签 / 图例名) |
value | number | 数值 |
type | string | 可选,分组字段,用于多系列图表 |
5.2 单系列示例
数据集返回:
[
  { "name": "Mon", "value": 120 },
  { "name": "Tue", "value": 200 },
  { "name": "Wed", "value": 150 }
]
配置只需定义图表结构,数据自动填入:
{
  "xAxis": { "type": "category" },
  "yAxis": { "type": "value" },
  "series": [{ "type": "bar" }]
}
5.3 多系列示例
数据集中带 type 字段时,组件会按 type 值自动分组,生成多个 series:
数据集返回:
[
  { "name": "Mon", "value": 120, "type": "销售额" },
  { "name": "Tue", "value": 200, "type": "销售额" },
  { "name": "Mon", "value": 80,  "type": "利润" },
  { "name": "Tue", "value": 100, "type": "利润" }
]
配置中只需写一个 series 作为模板,组件自动扩展为多系列并更新图例:
{
  "xAxis": { "type": "category" },
  "yAxis": { "type": "value" },
  "series": [{ "type": "bar" }]
}
5.4 支持的图表类型
绑定数据集时,以下图表类型均支持自动数据注入:
| 图表类型 | series.type 值 | 数据注入方式 |
|---|---|---|
| 柱状图 | bar | [value, ...],自动设置类目轴 |
| 折线图 | line | [value, ...],自动设置类目轴 |
| 面积图 | line(含 areaStyle) | 同折线图 |
| 饼图 | pie | [{name, value}] |
| 漏斗图 | funnel | [{name, value}] |
| 旭日图 | sunburst | [{name, value}] |
| 矩形树图 | treemap | [{name, value}] |
| 散点图 | scatter / effectScatter | [[name, value]] |
| 雷达图 | radar | 自动生成 indicator,数据格式 [{value:[...]}] |
| 仪表盘 | gauge | [{value, name}] |
| 象形柱图 | pictorialBar | [value, ...],自动设置类目轴 |
| 词云图 | wordCloud | [{name, value}] |
若不绑定数据集,或数据集格式不符合上述要求,组件将直接使用自定义配置中的静态数据,不做任何数据注入。